
 ADAS Mobile Plus
 ADAS HD
 Radar 3-in-1
 ADAS Pro Plus
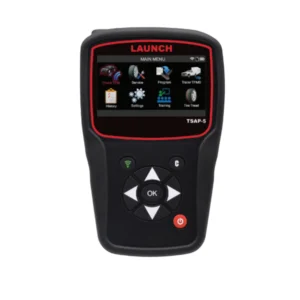 tsap-5
 TSAP-3
 Launch TPMS Sensor
 TTH-84 EV Tool Cart
 Diagnostic Add On Kit
 Modularized Wireless Equalizer – EVB 624
 EV Battery Airtightness Tester – EVT511
 EV Battery Pack Module Charging & Discharging Equipment – EVP711
 Intelligent Digital Power Supply – ELA400
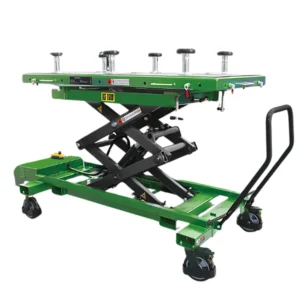 EV Battery Pack Lift – TLT615A
 EV Tool Cart – TTH116
 Professional Insulation Tester – ES200
 EV Clamp – EG100
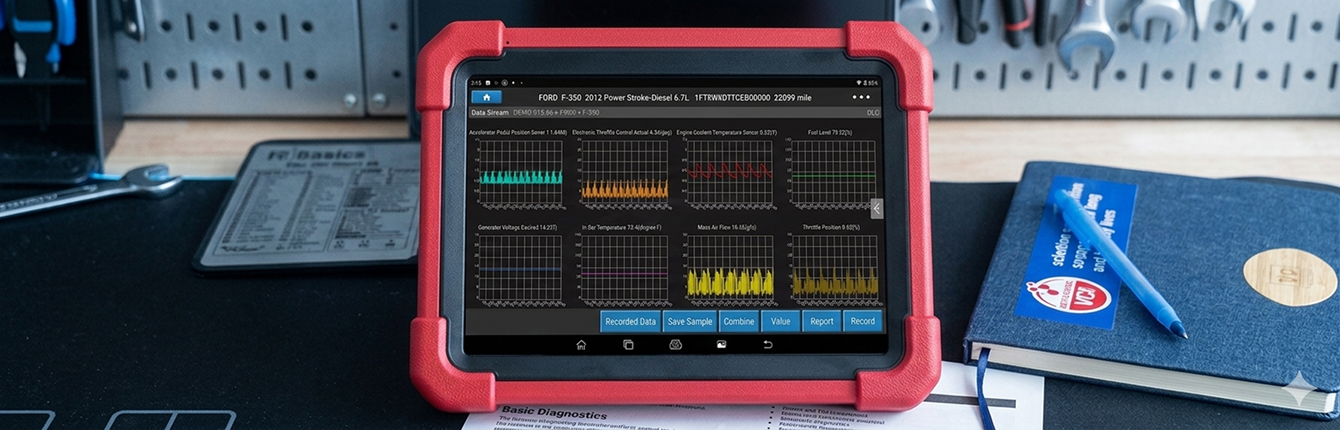
Live Data, Freeze Frame, and Graphing Explained
If you have ever spent a long afternoon under the hood of a car trying to figure out why a light is on or why the engine is stumbling, you know that a simple error code is rarely enough. To get to the bottom of a complex vehicle issue, you need a clearer picture of what is happening inside the computer. This is where live data, freeze frame, and graphing become your most valuable assets. These are not just technical terms but the primary tools that modern technicians use to stop guessing and start fixing.
When you use professional tools from Launch Tech USA, you get a direct window into the vehicle operation. Understanding how to use these features will transform how you approach every repair job in the USA.
The Power of Live Data
Live data is the continuous stream of information sent from the vehicle sensors to the control module while the car is running. Think of it as a heart monitor for the vehicle. Instead of looking at a static code, you are watching the actual performance of the engine, transmission, and braking systems as they function.
Why Live Data is Essential
A diagnostic trouble code might tell you that a sensor is out of range, but live data shows you exactly how that sensor is behaving. If you suspect a vacuum leak, you can watch the fuel trim numbers in real time. If those numbers change drastically when you spray a little cleaner around the intake manifold, you have found your problem without ever taking a part off the car.
Using this feature allows you to verify that the sensors are communicating properly. It helps you identify parts that are starting to fail even before they are bad enough to trigger a warning light on the dashboard.
Key Information Points to Monitor
- Engine speed to check for consistent idling
- Coolant temperature to ensure the thermostat is opening correctly
- Air flow readings to verify the intake system is clean
- Fuel trim percentages to see how the computer is balancing the air and fuel mixture
Capturing the Moment with Freeze Frame
One of the most frustrating parts of being a technician is trying to fix a problem that only happens once in a while. This is where freeze-frame data becomes a lifesaver. When the vehicle computer detects a fault and sets a code, it takes a digital snapshot of all the sensor readings at that exact microsecond.
Solving Intermittent Issues
If a customer says their car only acts up when they are accelerating onto the highway on a cold morning, you might not be able to replicate that in the shop. By looking at the freeze frame data, you can see the exact vehicle speed, engine load, and temperature at the moment the fault occurred.
This information acts like a witness to the event. It tells you if the car was moving or sitting still, if the engine was hot or cold, and exactly what the sensors were reporting when the failure happened. This saves hours of diagnostic time because you no longer have to drive the car for miles, hoping the problem happens again.
Visualizing the Problem with Graphing
Numbers are great, but sometimes they move too fast for the human eye to track. Graphing takes those digital numbers from the live data stream and turns them into a visual line or waveform. This is one of the most advanced capabilities of modern diagnostic tools, and it is essential for finding electrical glitches.
Seeing the Waveform
Components like oxygen sensors or throttle position sensors change their output very quickly. If you just look at the numbers, you might miss a tiny drop in voltage that causes a stumble. When you graph that data, a steady wave or a smooth line appears on the screen. If there is a flat spot or a sudden spike in that line, you have visual proof of a failing component.
Launch Tech USA tools allow you to overlay different graphs on top of each other. You can watch the relationship between the throttle pedal and the engine response at the same time. If the pedal moves up but the engine response lags behind on the graph, you have found a clear path to the repair.
How These Features Work Together in the Shop
To see how these capabilities improve your workflow, consider a car with a rough idle.
First, you look at the live data to see which cylinder is misfiring. Then, you check the freeze frame data to see if it happened while the car was in park or while it was under load. Finally, you graph the ignition system data to see if the spark is consistent. By the time you pick up a wrench, you already know exactly which part needs to be replaced. This level of precision is why professional tools are a requirement for any serious shop in the USA.
Features and Capabilities of Launch Tech USA Tools
Launch Tech USA builds diagnostic equipment specifically for the high demands of professional environments. The software is designed to be fast and intuitive, so you can get the data you need without scrolling through endless menus.
High Speed Processing
Data is only useful if it is accurate. Our tools use high-speed processors to ensure that the live data and graphs are updated instantly. This prevents the lag that you often find in cheaper, consumer-grade scanners. When a sensor spikes, you see it the moment it happens.
Data Recording and Playback
Some problems only show up during a long road test. Our tools allow you to record the live data stream while you are driving. You can then bring the tool back into the shop and play the recording back slowly. You can pause the data, zoom in on the graphs, and find the exact moment a sensor went out of range.
Extensive Vehicle Coverage
Our tools provide deep access to manufacturer-specific data. This means you get more than just the basic engine info. You can see live data for the transmission, the anti-lock braking system, the airbags, and even the climate control system. Having this level of detail allows you to offer more services to your customers and handle more complex repairs.
Making Better Repairs with Better Data
The goal of every repair is to get the vehicle back on the road as quickly and safely as possible. By using live data, freeze frame, and graphing, you move away from the old method of swapping parts and hoping for the best.
- Use live data to see the current health of the vehicle
- Use freeze frame to understand the history of the fault
- Use graphing to see the patterns that numbers alone cannot show
These features are the foundation of modern diagnostics. They allow you to provide a higher level of service and build trust with your customers by showing them exactly what is wrong with their vehicle.
Professional Results Every Time
Understanding these three pillars of vehicle communication is what makes you a better technician. You are no longer just reading code, but you are actually interpreting the behavior of the machine. We hope this guide has cleared up any confusion about how to use these powerful features to your advantage.
Launch Tech USA is proud to provide the tools that make this level of detail possible for shops across the USA. When you have the right technology in your hands, no diagnostic challenge is too difficult. You now have the knowledge to use these features to their full potential and ensure every vehicle you service is repaired with total accuracy.